Disability Intermediaries Australia take a deep look into NDIS sustainability
You could be excused for having missed the release of the interim update to the Annual Financial Sustainability Report as it was quietly made public on Saturday 3rd July! It is hard not to be cynical that the weekend release was an attempt or hope that we wouldn’t notice.
The NDIA is required to release an Annual Financial Sustainability Report (AFSR) under section 180B of the NDIS Act, this report is expected to provide an assessment of the financial sustainability of the NDIS.
The AFSR has lots of numbers, most of them are big! This interim update to the AFSR has created lots of click-bait, headlines and soundbites. Disability Intermediaries Australia (DIA) has taken the time to trawl through the report to understand what sits behind the headline figures.
Unfortunately like much of the communication coming out of the NDIA, we find ourselves with even more questions than we did before. If DIA was to sum up our thoughts on the document and the story it tells, it would be “Really? Are you sure?”.
DIA also notes that the ASFR appears to have been updated between its initial release on 3 July 2021 and 14 July 2021, without any statement or explanation as to why?
To spare you trawling through the 84 or 87 pages of NDIS jargon, depending on which version you downloaded, DIA have picked out the key points from the key areas of the report:
- Differences in document versions;
- Number of participants entering the scheme;
- Scheme inflation;
- Participant exits;
- Participant spend;
- Cost of the scheme;
- Is the NDIS bigger than Medicare
Difference in document versions
For such an important document, DIA is not sure why the NDIA have not publicly acknowledged and explained why they have made changes to the document.
DIA notes that the document currently on the NDIA website is 3 pages longer than then original document released on the 3rd July 2021 (87 pages up from 84 pages).
DIA also notes that there are some changes to the figures contained within Tables of the ASFR.
Whilst DIA acknowledge that on the surface these appear to be minor changes, DIA can’t help but wonder why the NDIA felt the need to correct them, or why they have not explained the changes?
It could indicate that the initial release was rushed out with some inaccuracies, prior to the Sate and Territory meeting with the Commonwealth to discuss scheme reforms, in the hope of bolstering the NDIA’s position that the Scheme Sustainability is out of control and requires substantive and immediate reforms to correct. However, in correcting these it has created further drafting problems with cross referencing.
Alternatively, the NDIA might have just uploaded the wrong document (perhaps an old draft).
Either way, these questions could have simply been addressed by adding a version number or updating the publication date.
Below are the major changes we have picked up:
| Original ASFR (as at 3/7/21) Item |
Current ASFR (as at 14/7/21) Item |
NDIA Changes |
| Table 1 | Table 1a & 1b | 1. Split the original single table into two tables to seperate cash and accural figures. |
| Table 7 | Table 7a & 8b |
1. Split the original single table into two tables to seperate actural vs expected and proportion of payments. 2. Reference in description below table in revised version now contains table number reference errors. |
| Table 8 | Table 9 |
1. Table renumbered. 2. Reference in description below table in revised version now contains table number reference errors. |
| Table 9 | Table 10 |
1. Table renumbered. 2. Reference in description below table in revised version now contains table number reference errors. |
| Table 10 | Table 11 |
1. Table renumbered. 2. Reference in description below table in revised version now contains table number reference errors. |
| Table 11 | Table 12 |
1. Table renumbered. 2. Reference in description below table in revised version now contains table number reference errors. |
| Table 12 | Table 13 |
1. Table renumbered. 2. Reference in description below table in revised version now contains table number reference errors. |
| Table 13 | Table 14 |
1. Table renumbered. 2. Reference in description below table in revised version now contains table number reference errors. |
| Table 14 | Table 14 |
1. Table renumbered. 2. Reference in description below table in revised version now contains table number reference errors. |
| Table 15 | Table 16 |
1. Table renumbered. 2. Reference in description below table in revised version now contains table number reference errors. |
| Table 16 | Table 17 |
1. Table renumbered. 2. Reference in description below table in revised version now contains table number reference errors. |
| Table 17 | Table 18 |
1. Table renumbered. 2. Reference in description below table in revised version now contains table number reference errors. |
| Table 18 | Table 19 |
1. Table renumbered. 2. Data change for 19-24 Total figure 73,697 (original) – 73,695 (revised). 3. Data change for 25-34 Autism figure 99,498 (original) – 99,048 (revised). 4. Reference in description below table in revised version now contains table number reference errors. |
| Table 19 | Table 20 |
1. Table renumbered 2. Data change for 15-18 Consumables figure 722 (original) – 711 (revised) 3. Data change for 19-24 Total figure 73,697 (original) – 4,327 (revised) which DIA believe is an error. 4. Reference in description below table in revised version now contains table number reference errors. |
| Table 20 | Table 21a & 22b |
1. Split the original single table into two tables to seperate cash and accural figures. 2. Reference in description below table in revised version now contains table number reference errors. |
| Table 21 | Table 23 |
1. Table renumbered. 2. Reference in description below table in revised version now contains table number reference errors. |
| Table 22 | Table 24 |
1. Table renumbered – noting that the revised document now has two sepearte tables called table 24 (one on page 69 and one on page 70). 2. Reference in description below table in revised version now contains table number reference errors. |
| Table 23 | Table 24 |
1. Table renumbered – noting that the revised document now has two sepearte tables called table 24 (one on page 69 and one on page 70). 2. Reference in description below table in revised version now contains table number reference errors. |
| Table 24 | Table 25 |
1. Table renumbered. 2. Reference in description below table in revised version now contains table number reference errors. |
| Table 26 | Table 27 |
1. Table renumbered. 2. Reference in description below table in revised version now contains table number reference errors. |
| Table 27 | Table 28 |
1. Table renumbered. 2. Reference in description below table in revised version now contains table number reference errors. |
| Table 28 | Table 29 |
1. Table renumbered. 2. Reference in description below table in revised version now contains table number reference errors. |
Here are the links to the documents, should you wish to review the differences yourself
- Original ASFR (pdf) (84 page document – released by the NDIA on 3rd July 2021)
- Revised / Current ASFR (pdf) (87 page document – from NDIA webpage last updated on the 14th July 2021)
Number of participants entering the scheme
This is where the big numbers and questions start.
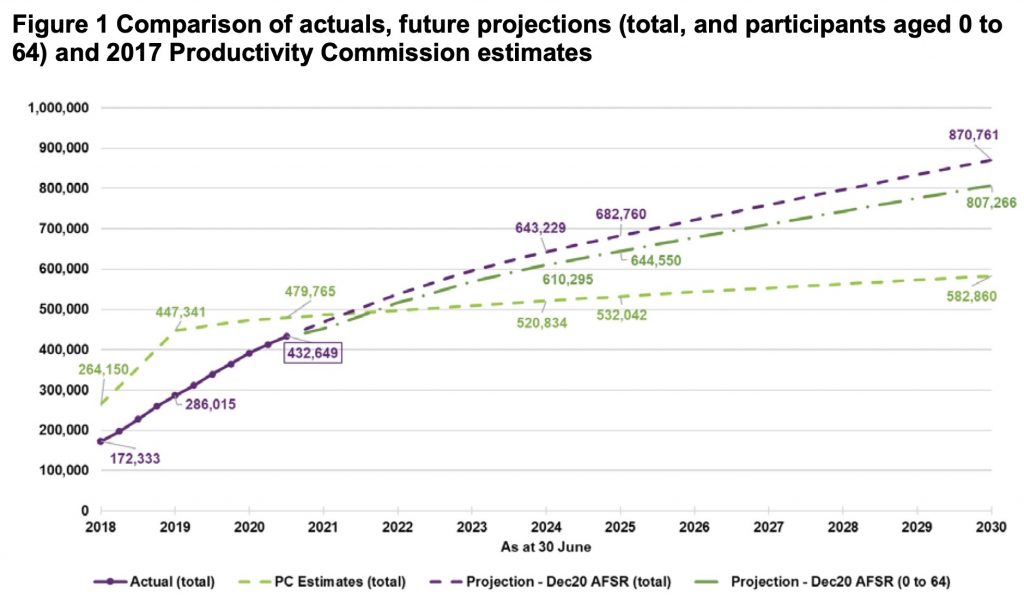
The NDIA are projecting that by 2030 there will be 870,761 participants in the NDIS whereas, just 4 years ago, the Productivity Commission forecast 582,860 participants would be in the Scheme.
This represents a 49% difference! Did the Productivity Commission really get it that wrong?
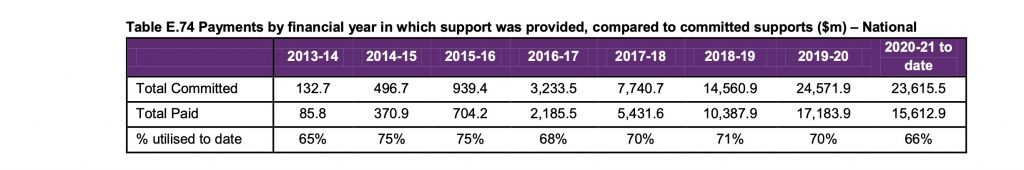
 Source: Annual Financial Sustainability
Report Summary – Interim update
A quick visual analysis of the chart above raises some pretty obvious questions. The NDIS has spent 4 years below the projected numbers and now we will suddenly diverge so rapidly and by so much?
In 2017 the Productivity Commission said that there would be a delay in the NDIS meeting its bilateral estimates due to the delays in the early roll out of the NDIS.
“If the current trend continues, it will take an additional year (2020-21) before all 475 000 participants will be in the scheme though this delay could be longer if the scheme falls further behind the bilateral estimates when the participant intake ramps up in 2017-18”
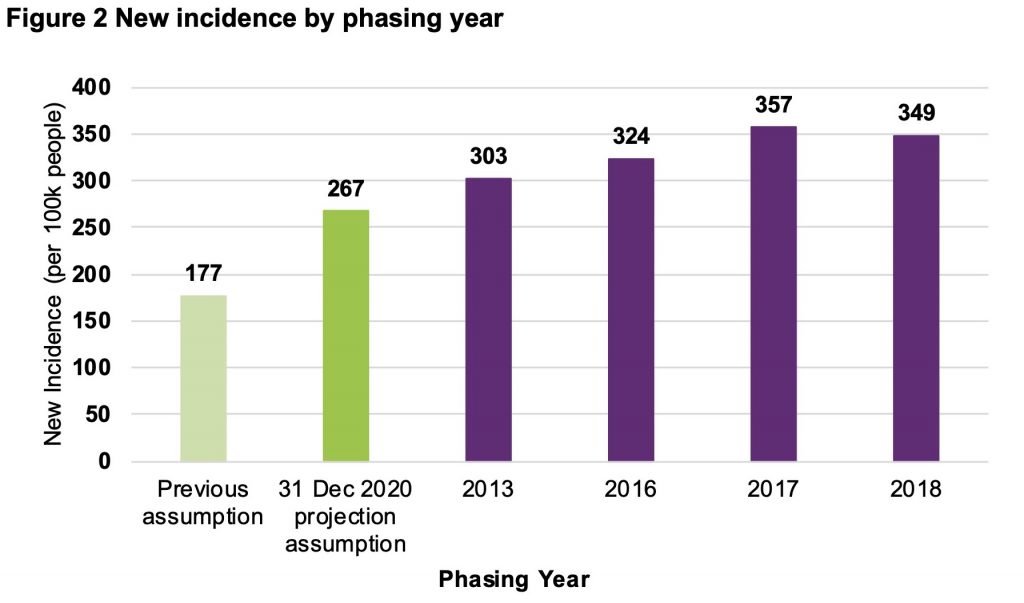
However, what the NDIA sustainability report says, is that the number of people in the population that will enter the Scheme (267 per 100,000 people) up from 177 per 100,000 people that drove the Productivity Commission’s 2017 assumptions.
Source: Annual Financial Sustainability
Report Summary – Interim update
DIA has so many questions on what the 267 per 100,000 of people represents! What isn’t clear is:
- The detail behind how the 267 assumption arrived at? (In our view the detail in the Appendix is threadbare).
- Is the 267 assumption used in each of the forward years?
- Is the 267 assumption then applied to the current disability cohorts? And if so, why has there been such a change in the past 4 years?
This begs the question – Where have these people been considering we are now at “Full Scheme”?
- We know that they won’t be in the State system as the States have moved quickly to transition these people;
- Surely the NDIA don’t believe these extra people are self-funding their support and will now move into the NDIS?
Considering that to be accepted by the Scheme, disability needs to be “permanent and significant” so how can this number change (almost 100 extra people per 100,000) without a change in the accessibility rules? If anything the fear within the disability community is that being accepted is becoming harder, not easier.
The NDIA give only some explanation to how these numbers increase by so much between now and 2030 buried under a table on Page 58:
The increase in projected participant numbers prior to 2030 is mainly attributable to higher assumed prevalence of developmental delay. After 2030, autism and intellectual disability are the main drivers of increasing participant numbers, reflecting the transition of children with developmental delay to autism and intellectual disability. The trajectory is consistent with the increasing trends seen in successive Surveys of Disability, Caring and Ageing (released by the ABS) but based on Scheme experience is projected to increase at a faster rate.
Source: Annual Financial Sustainability
Report Summary – Interim update
We find the description doesn’t seem to align with the in the table. The lack of detail, information and explanation disappointing.
Firstly the statement, “The increase in projected participant numbers prior to 2030 is mainly attributable to higher assumed prevalence of developmental delay” is inaccurate based on the data from the table. See below DIA analysis using the data from the table.
Secondly the statement, ‘After 2030, autism and intellectual disability are the main drivers of increasing participant numbers, reflecting the transition of children with developmental delay to autism and intellectual disability.” is inaccurate based on the data provided by the NDIA above – as you can see from the DIA analysis below has created prior to 2030 Autism remains the largest increase both in terms of actual numbers and percentage.
Increase by total number 2021 to 2030 based on NDIA data
| Disability Cohort | Raw number increase | |
| 1 | Autism | 192623 |
| 2 | Intellectual Disability | 54923 |
| 3 | Other | 52136 |
| 4 | Psychosocial Disability | 42393 |
| 5 | Developmental Delay | 36114 |
| 6 | Sensory | 23880 |
Increase as a percentage 2021 to 2030 based on NDIA data
| b | Disability Cohort | Percentage increase |
| 1 | Autism | 132% |
| 2 | Psychosocial Disability | 88% |
| 3 | Sensory | 68% |
| 4 | Developmental Delay | 68% |
| 5 | Intellectual Disability | 60% |
| 6 | Other | 55% |
The description not really reflecting the data in graph makes us further ask – are you sure?
Scheme inflation
As we all experience in our daily lives, inflation of prices is an ongoing economic reality with fluctuating levels depending on the prevailing economic conditions. We would therefore expect the NDIS to experience a similar reality.
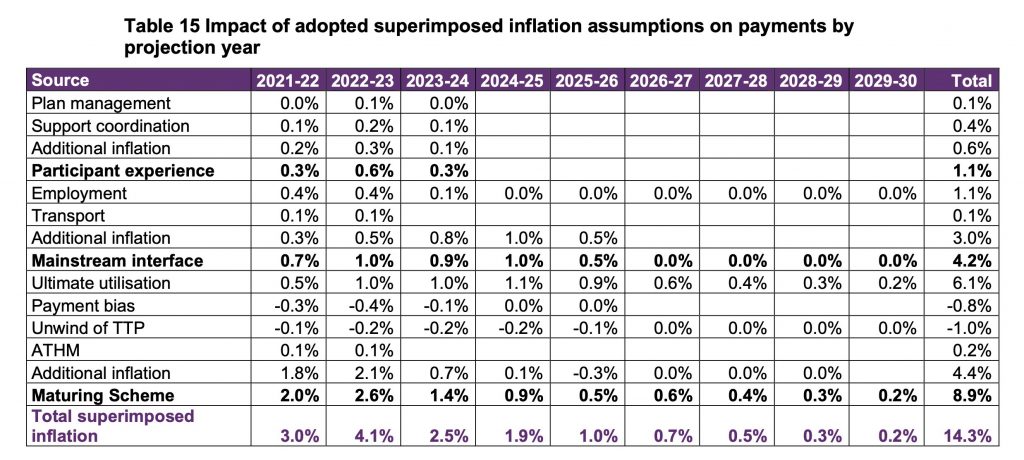
The NDIA has flagged that ‘superimposed inflation’ (inflation above the level experienced in the general economy) in the Scheme is a critical sustainability issue.
Source: Annual Financial Sustainability
Report Summary – Interim update
What struck DIA with this table is the proportion of the expected superimposed inflation that can’t be explained! ‘Additional Inflation’ accounts for 8% (0.6%, 3.00% and 4.4%) of the expected 14.3% inflation rate over the forecast period! In any modelling a reasonable amount of buffer is acceptable, but over 50%? We don’t buy that! Also, an increase in utilisation accounts for another 6% which will delve a bit deeper into later.
A couple of other anomalies stuck out:
- Why does Plan Management, Support Coordination and ‘Additional Inflation’ end in 2023 – 2024?
- 2021-22 Super inflation for Support Coordination of 0.1%, when Support Coordination (and Plan Management as well) has not received any increase to the NDIS price limit, no increase CPI nothing, so how does the NDIA really believe this will increase when the sector has already taken a haircut to the price limit.
- Transport in 2022 – 2023?
- The second instalment of “Additional Inflation” in 2025 – 2026? and;
- ATHM in 2022 – 2023?
- Also, the TTP has been a known part of the price settings and the glide path of its removal is also well publicised, so how can this be a negative in terms of inflation? And remember, the TTP prices are linked to underlying supports which are subject to at least Fair Work increases
The entire superimposed inflation table lacks any underlying explanations to the inflation rates presented and with over 50% of the supposed increases under “Additional Inflation”, it is incredibly difficult to give any credibility to the assertions made on the back of these rates.
Further the underlying assumption that inflation will be see across the sector every year for 2021 – 2030, however this is simply not the case. Whist CPI pressure are constantly felt by providers the NDIA has on a number occasions, including in 2021, have not increased all price limits and participants plans to reflect CPI. In the most recently announced NDIS Pricing Arrangements and Price Limits (price Guide) more than half of all service line items were not increased to factor in CPI, increases in Super or increase in Wage Settings.
In terms of Plan Management and Support Coordination which is called out as contributing to the increased costs as:
“Increasing use of support coordination and of plan management. This reflects a greater desire from participants for more choice and control”.
Source: Annual Financial Sustainability
Report Summary – Interim update
In terms of the numbers let’s do a quick calculation to gauge the monetary impact that this will have in 2022 – 2023.
Projected Scheme “cost” in 2022 – 2023 is $32.436bln.
- Plan Management “inflation” is forecast at 0.1%. In terms of ‘cost’ this equals $32.43 million, which equates to an additional 21,500 participants using a Plan Manager at an average yearly ‘cost’ of $1,500.
- Support Coordination inflation is forecast at 0.2%. In terms of ‘cost’ this equals $64.86 million, which equates to an additional 21,200 participants using a Support Coordinator for just under 30 hours at Level 2.
Hardly a huge sustainability problem for the NDIS, the anticipated increase in Plan Management and Support Coordination is less than $100 million, whilst dramatically increasing choice and control and delivering benefit to both participants and the Scheme (which is not discussed anywhere in the report). The social return on this support is fantastic, let alone the outcomes generated whilst maximising the value of a participants plan.
Scheme exits
Scheme exits are tracking below the baseline rates in 2020 but we aren’t given any detail as to why this may be the case and how this may change in the future. In terms of the 0 – 6 age cohort are there issues in executing the ECEI targets that underpinned the forecasts in the 2021 – 2022 PBS forecast?
It’s concerning that forecasts prepared for the current budget year can be so far from what is happening with exit rates for the 0 – 6 age group being circa 0.5% whereas the PBS forecast was 2%.
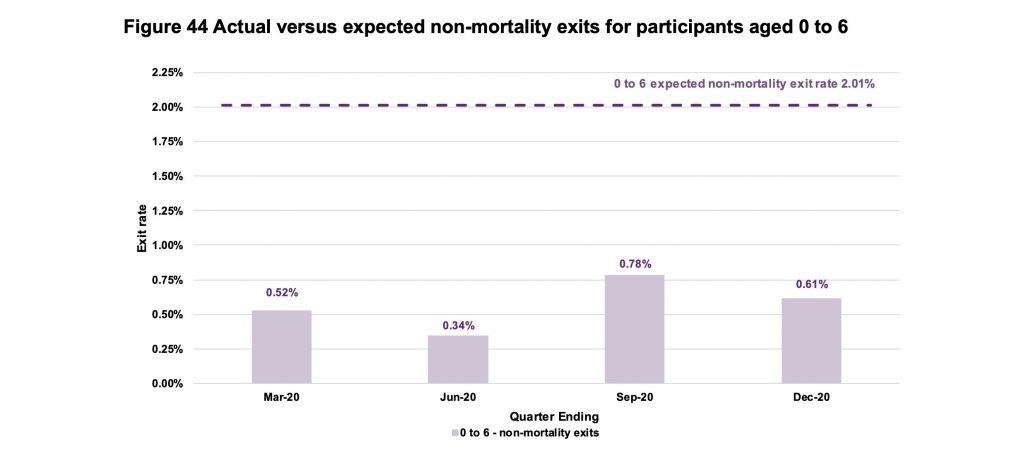
Source: Annual Financial Sustainability
Report Summary – Interim update
It’s concerning that the past year has seen declining exit rates for those over 7 years of age.
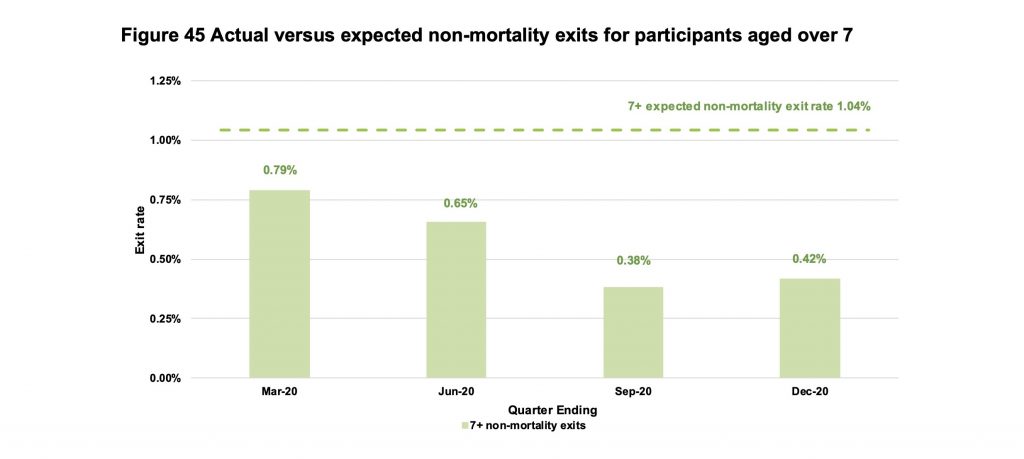
Whilst concerning it’s hardly a surprise considering the issues plaguing the aged care system that would, on assumption, attract a large portion of the participants reaching 65 years of age.
This is also a point worth thinking about from a holistic economy of view – seeing as we are all hung up about sustainability. The NDIS and Aged Care are funded from essentially the same pot of public money so, if there is a greater retention rate of 65 year plus aged participants in the NDIS then this would reduce the funding required in the Aged Care sector! (Granted not $1 for $1 due to the difference in funding levels but certainly enough to be of significance).
Don’t just take DIA’s word for it, the Productivity Commission said:
“Participants aged 65 years and over The proportion of NDIS costs that is attributable to participants aged 65 years and over will increase over time. This suggests that the share of total NDIS funding provided by the Australian Government will increase substantially over time as it is responsible for the funding of all participants aged 65 years and over (and all Indigenous participants aged over 50 years). This does not necessarily mean that there will be a sizable net cost to the Australian Government, as it also has primary funding responsibility for the aged care system.”
Source: Productivity Commission Report 2017
So just because the exit rates are lower than anticipated, it doesn’t necessarily follow that this is an extra overall cost to the government is unforeseen. These people clearly still require support and this support will need to be funded somewhere – be it the NDIS, Aged Care or Health Systems it will likely cost somewhere. DIA would love to see a greater breakdown of these figure and where participants haven’t exited the NDIS how much of a ‘saving’ has been realised by other governmental service.
Participant spend
Having outlined our concerns regarding the superimposed inflation assumptions, it comes as no surprise that if you take the per participant spend of 2021 – 2022 and apply the project inflation rates year-on-year you naturally get an acceleration of the per participant payments. Remember, over half of this superimposed inflation is categorized as ‘Additional Inflation’ with the remainder being made up of mostly an increase in assumed plan utilisation.
Source: Annual Financial Sustainability
Report Summary – Interim update
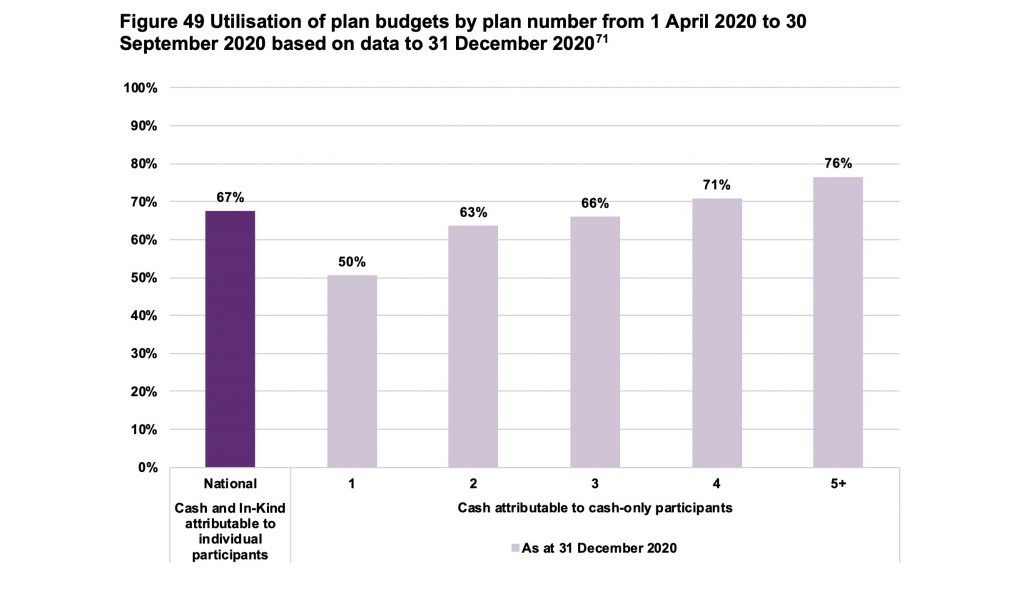
The increased utilisation assumption is based on the observed relationship between increased utilisation rates and the length of time, expressed by the number of plans a participant has received, that a participant has been in the Scheme with data from 1 April 2020 to 30 September 2020 referenced:
Source: Annual Financial Sustainability
Report Summary – Interim update
What is questionable is using this short-term snapshot, to infer an enevitable increase the level of utilisation based on the 5th plan utilisation number whereas the history of the Scheme suggests that utilisation is relatively stable at circa 70%. Below is information published by the NDIA in the most recent quarterly report.
Source: NDIA Q3 2020-21 Report
No surprises that by assuming an increasing number of participants in the Scheme quicker than previously forecast, as we highlighted in the Participant Entry Numbers section, it means more participants will ‘mature’ sooner and then a higher utilisation rate can be applied, or so it seems to be the case in this report!
Further the NDIA needs to communicate the difference between plan spend, average plan value and median plan value across the duration of the scheme thus far as there three data points interact with each other. DIA has heard from 1000’s of participants that have seen ever decreasing plan values, which in turn means high utilisation rates.
Total cost
So now for the BIG number that keeps getting shouted from every outlet the NDIA can send a media release to or a member of the Government can get air time on. Yep, $60 billion dollars. As we have highlighted, when you:
- Increase participants by circa 50% on previous forecasts;
- Inflate the Scheme by over 14%;
- Don’t recognise the offsetting impact that over 65 year olds not entering Aged Care or Health System settings have on that expenditure; and
- Apply all of this to participant spending;
You get:
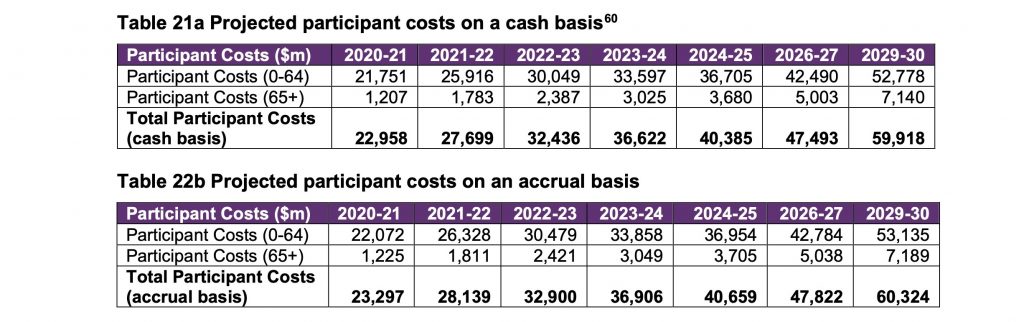
Source: Annual Financial Sustainability
Report Summary – Interim update
This projection is widely different to the most recent PBS forecasts. DIA understand and recognise that forecasting is subjective (and more often than not by its nature wrong) but when two ‘Government’ forecasts are $9 billon different for the 2024-2025 year ($40.385 v $31.884) we really need to ask why?
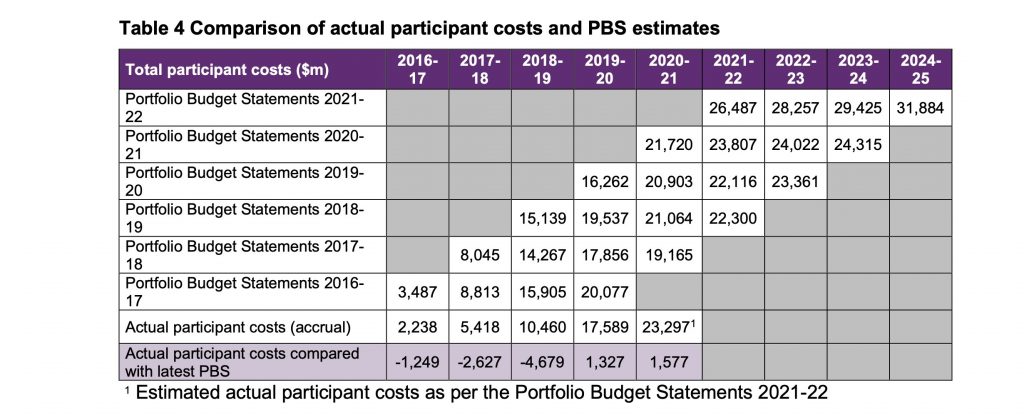
Source: Annual Financial Sustainability
Report Summary – Interim update
Looking at the historical accuracy of the PBS statements on a rolling three and four year basis we see that initial estimates tend to have an accuracy rate of approximately 85% to 90% which narrows down to roughly 6% to 7% one year out, not bad for Government work! Even better when you consider that there are a number of supports that were brought into the NDIS after this forecasting was done, such as Disability Health Supports.
Further as previously discussed, the NDIA needs to communicate the difference between plan spend, average plan value and median plan value across the duration of the scheme thus far as there three data points interact with each other. DIA has heard from 1000’s of participants that have seen ever decreasing plan values, which in turn means high utilisation rates.
Is the NDIS Bigger than Medicare
One talking point that is really causing blood pressure to rise at DIA Headquarters is the often trotted out statement that ‘the NDIS will cost more than Medicare!’. This is emotive language and being deliberately used to conjure up a negative public sentiment around the amount of money that is spent on the NDIS. Whilst based on these projections the NDIS may tecnnicly become larger than Medicare, it is worth noting:
- Medicare is a Scheme that has universal support across the country, but what are the Government referencing when they link the cost of Medicare to the cost of the NDIS? In our view it’s not how the average person on the street would describe ‘Medicare’.
- The average person on the street, in our experience, doesn’t know that ‘Medicare’ isn’t the holistic health system. For example Medicare doesn’t fund the State hospital systems. For most, Medicare is for going to see the GP and the ever decreasing part of the fee you pay when you see a Specialist. If we want to talk properly we should reference the holistic healthcare system which is at least 3 if not 4 times the cost of the NDIS.
Conclusion
It is difficult to believe and deeply understand the drivers of the forecasts that the NDIA have put out in this interim update to the Annual Financial Sustainability Report.
We don’t have to go too far back to see that the NDIA has not always been particularly accurate at forecasting. Remember that the 2017 Budget Papers had a shocking cost blowout of over $50 bln across the forward 10 years which prompted a hike in the Medicare Levy and a purpose built NDIS Savings Fund, which was quickly reversed in 2019 as an ‘error’ of $6.5 bln had been made in the forecasts! This subsequent underspend was reclaimed by the Government and used to proclaim a budget surplus.
Coupled with the NDIA’s own words from the 2019 – 2020 Annual Report that current costs where inline with the 2017 Productivity Commission and that:
“Pressures on the scheme have been identified and are being responsibly managed.”
As a sector, if we are truly to understand a ‘sustainability crisis’ then we need to understand the assumptions that are driving the inputs of the modelling but DIA isn’t holding our breath to see those given the recent exchange in Senate Estimates on 3rd May 2021 between Senator Jordan Steele-John and the CEO of the NDIA, Martin Hoffman, and the Minister:
Senator STEELE-JOHN: And could you please also provide to the committee the actuarial assumptions that underpin that piece of work? Those are two critical documents that allow us to assess independently whether the assertions that the agency makes in relation to the forward projected cost of the scheme are to be taken seriously. So can we have the actuarial models, please?
Mr Hoffman: I’ll take that question on notice, yes.
Senator STEELE-JOHN: Alright. Now, Minister, just so that you are aware, it’s not the first time I have made that request for those two pieces of documentation. Previously they have been refused. I ask you to take another look at this because of the absence of trust in which we are having this conversation at the moment, and because the question of sustainability, as I said, is as a subjective contention. The objective piece is the data, and we need to be able to see the data for ourselves.
Senator Reynolds: No, no, I will very happily take that away and have a look. I do know, though, that for the actuarial assumptions themselves, I don’t think there is any insurance scheme, either public or private, that would ever release their actuarial assumptions. However, that said, I will have a look at the financial reports and see what is possible to release.
Senator STEELE-JOHN: As you noted in your opening statement, Minister, the NDIS is a world-first undertaking and, in the absence of those actuarial assumptions, we have to take it as a question of trust, and trust is something that doesn’t exist at the moment.
Not surprisingly we haven’t seen any of the information that Senator Steele-John requested and hence we have no basis to trust these forecasts.
So how do we tackle Scheme sustainability? Maybe we look more broadly as the Productivity Commission said:
In any case, point estimates of total scheme costs do not tell the whole story. Financial sustainability is about both costs and benefits, and risks to financial sustainability cannot always be easily modelled, or identified from scheme data. A long-term focus, both within and outside the NDIS, is therefore important.
If the NDIA, Government and the disability community could follow the Productivity Commission’s words then we could actually have a meaningful conversation about sustainability rather than the current shock and awe campaign.
DIA is eager and willing to have a detailed, robust and honest conversation with government and the NDIA on the long term sustainability and outcomes of the NDIS.